
What IS Greening the Spark?
Greening the Spark is about green electricity. And not so green electricity. It’s about how we generate, store and distribute electricity around the country and how we can control how much it costs and what impact it has on the environment.
§ If you want to see what’s new go straight to News
Greening the Spark is a model of a system for electricity generation, distribution, storage and consumption – in short, a typical national grid. Originally started as a proof of concept and general purpose simulator, it has been developed over the past three years as a demonstrator for a hands-on museum exhibit. To help clarify the scope of the project, here is a list of questions it is intended to answer and ones that it is not designed to answer:
Too fundamental:
- What is electricity?
- What is electricity used for?
What this project addresses:
- Where does our electricity come from?
- How does electricity get to where it’s needed?
- How are electricity supply and demand matched?
- How much of world energy consumption is electric?
- How much electric power comes from each kind of source?
- What is green electricity and how green is it?
- What are the relative costs of each type, both financially and in terms of environmental impact?
- What types of electrical energy storage are there, how much is needed and what are their costs?
Too far ahead:
- How safe are the different types of electricity production?
- How green will our electricity be by 2030 and 2050?
- Will we have the resources to build and fuel enough electricity production and storage for future consumption?
- When will nuclear fusion be a viable source of electrical energy?
Greening the Spark has physical representations and software models of the basic elements of a modern national grid. It can be operated as a standalone exhibit and played as a game via two hardware control panels.
§ If you want to get straight to the nitty-gritty go to the Tech-Talk page.
The following is a summary of what Greening the Spark is and what it does. For a general overview you can download my Powerpoint presentation here.
Infrastructure
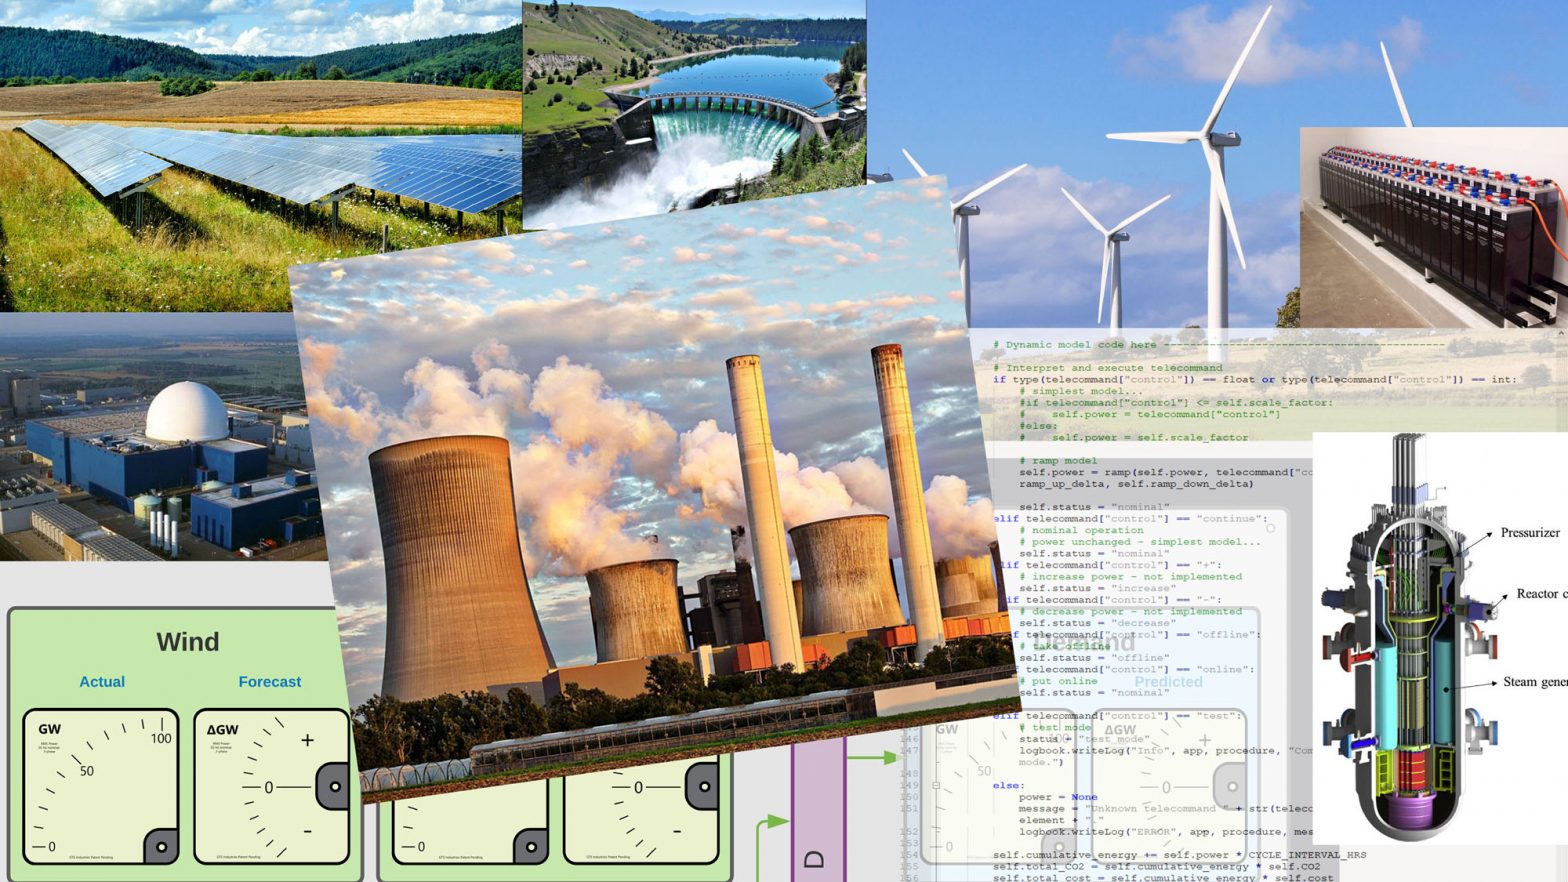
Emulating a typical national electricity grid, Greening the Spark provides physical models of wind and solar farms, fossil fuel and nuclear power stations, battery and pumped hydroelectric storage, consumer demand (residential and commercial) and a grid monitoring and control system interface (the hands-on bit).
Software Models
Scenarios are presented as predefined timelines of weather (wind & sun) and consumer demand, with forecasts for each. Fossil fuels and nuclear power generation can be controlled manually by an operator or autonomously. Storage elements are controlled by an autonomous storage management system.
Each of these elements can be scaled individually, so configurations past, present and future can be modelled with different proportions of renewables and non-renewables, different mixes of fossil fuels such as gas and coal and conventional nuclear and small modular reactors. The configuration is easily extended to include other elements such as biofuels, tidal, hydrogen, geothermal, etc.
Physical Models
The wind and solar farms are represented as a group of model wind turbines and a sun lamp with a mural of a wind and solar farm behind.
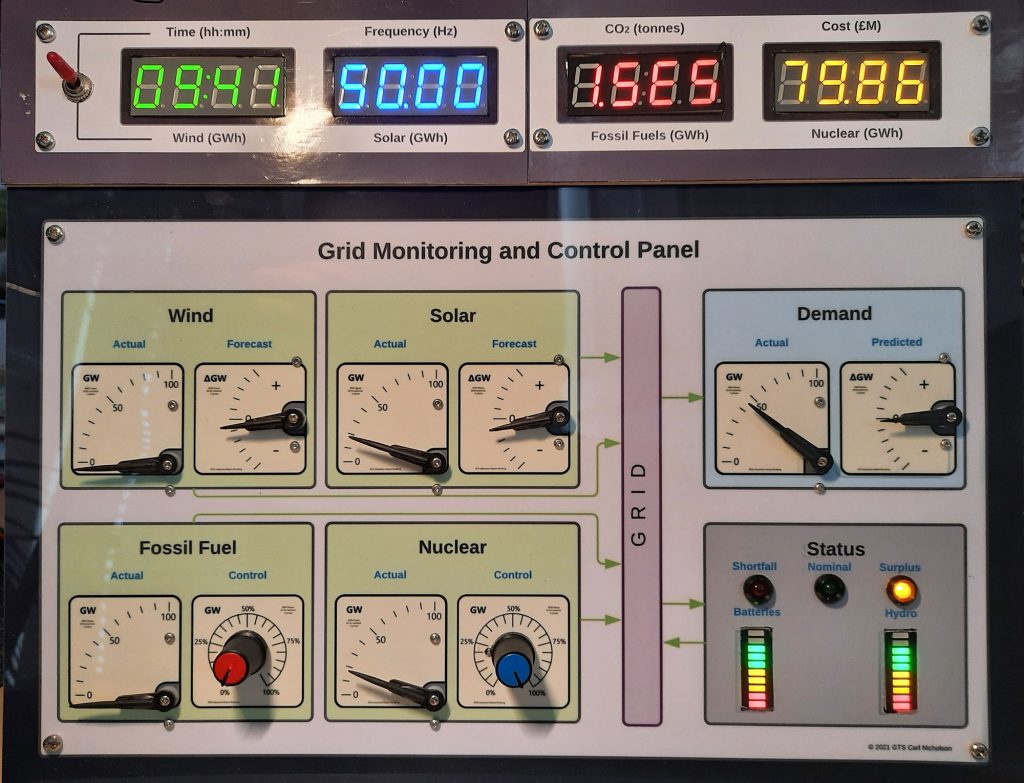
The operator interface to the grid monitoring and control system is a >>real<< physical control panel with various displays and control inputs as shown in the picture below.
Modes of Operation
There are two modes of operation:
Exhibit mode. This runs in real time and is a model of a national grid control centre with hands-on or autonomous control of fossil fuels and nuclear power generation. Manual control is initiated by touching one of the controls; autonomous control is resumed after a period of inactivity.
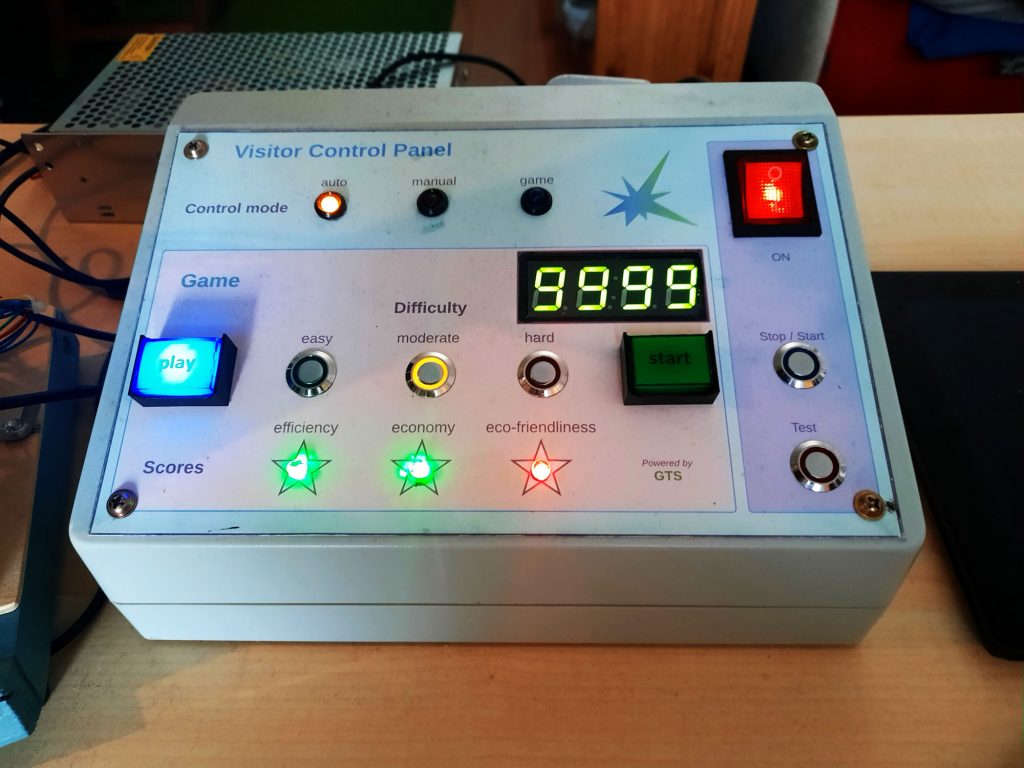
Game mode. This involves controlling the grid in fast forward time, covering a whole day in a just a few minutes. The objective is to adjust fossil fuels and nuclear power generated to avoid any blackouts or surplus power, to minimise either cost or carbon footprint and to keep the storage levels at roughly 50%. There are three levels of difficulty (easy, moderate and hard) and the results are presented in the form of three “e-sparks”, which are red, blue or green depending on overall performance.
Operation is controlled via the visitor and staff control panels (shown together below).
Two guides and a robotic system voice explain and entertain at every stage of operation which, together with ambient background sounds, bring the whole installation to life.
What (ever) next?
This is a proof of concept prototype which demonstrates the basic functionality of a national grid, presented as a hands-on museum exhibit.
There are many ways in which it can be developed, such as extending the range and sophistication of the physical and software models, theming and artwork, enabling remote access, live streaming of National Grid data, networking with other installations, advanced GUI design, AI control, data analysis and presentation – the list is endless.
Further information
I will be happy to give short a presentation and demonstration at my home in Brighton, UK. This takes about an hour, depending on the number of questions.
For more technical details on GTS, please visit my Tech-Talk page which includes detailed descriptions of software, hardware, operation and – of course – more pictures.
For news on developments, go to the News page.
If you are a developer / maker and wish to get involved in the project, please download the Request for Proposal below which details project and partner requirements.
For all other information about the author and website, see the Info page.